A foundation repair crew walks a property with a laser level. They capture elevation readings at every corner, every crack, every low spot in the slab. By the end of the walk, they know exactly what's wrong with the house.
The homeowner doesn't. They're looking at a spreadsheet full of numbers that mean nothing to them.
That gap, between what a pro measures and what a homeowner understands, is why ArcSite built Topographic Drawings. We sat down with three of the people behind it: Anthony Sarraino, Senior Product Marketing Manager, Tim Rice, Product Manager, and Patrick Caldwell, Director of Product Enablement, to talk through how it came together.
The problem wasn't the measurement
Pros already had the tools to measure elevation. What they didn't have was a way to make those measurements land with a homeowner standing in their kitchen.
"They're using sophisticated tools to measure elevations, but it was just numbers on a page," Tim said. "That's much harder to explain what's going wrong to the homeowner."
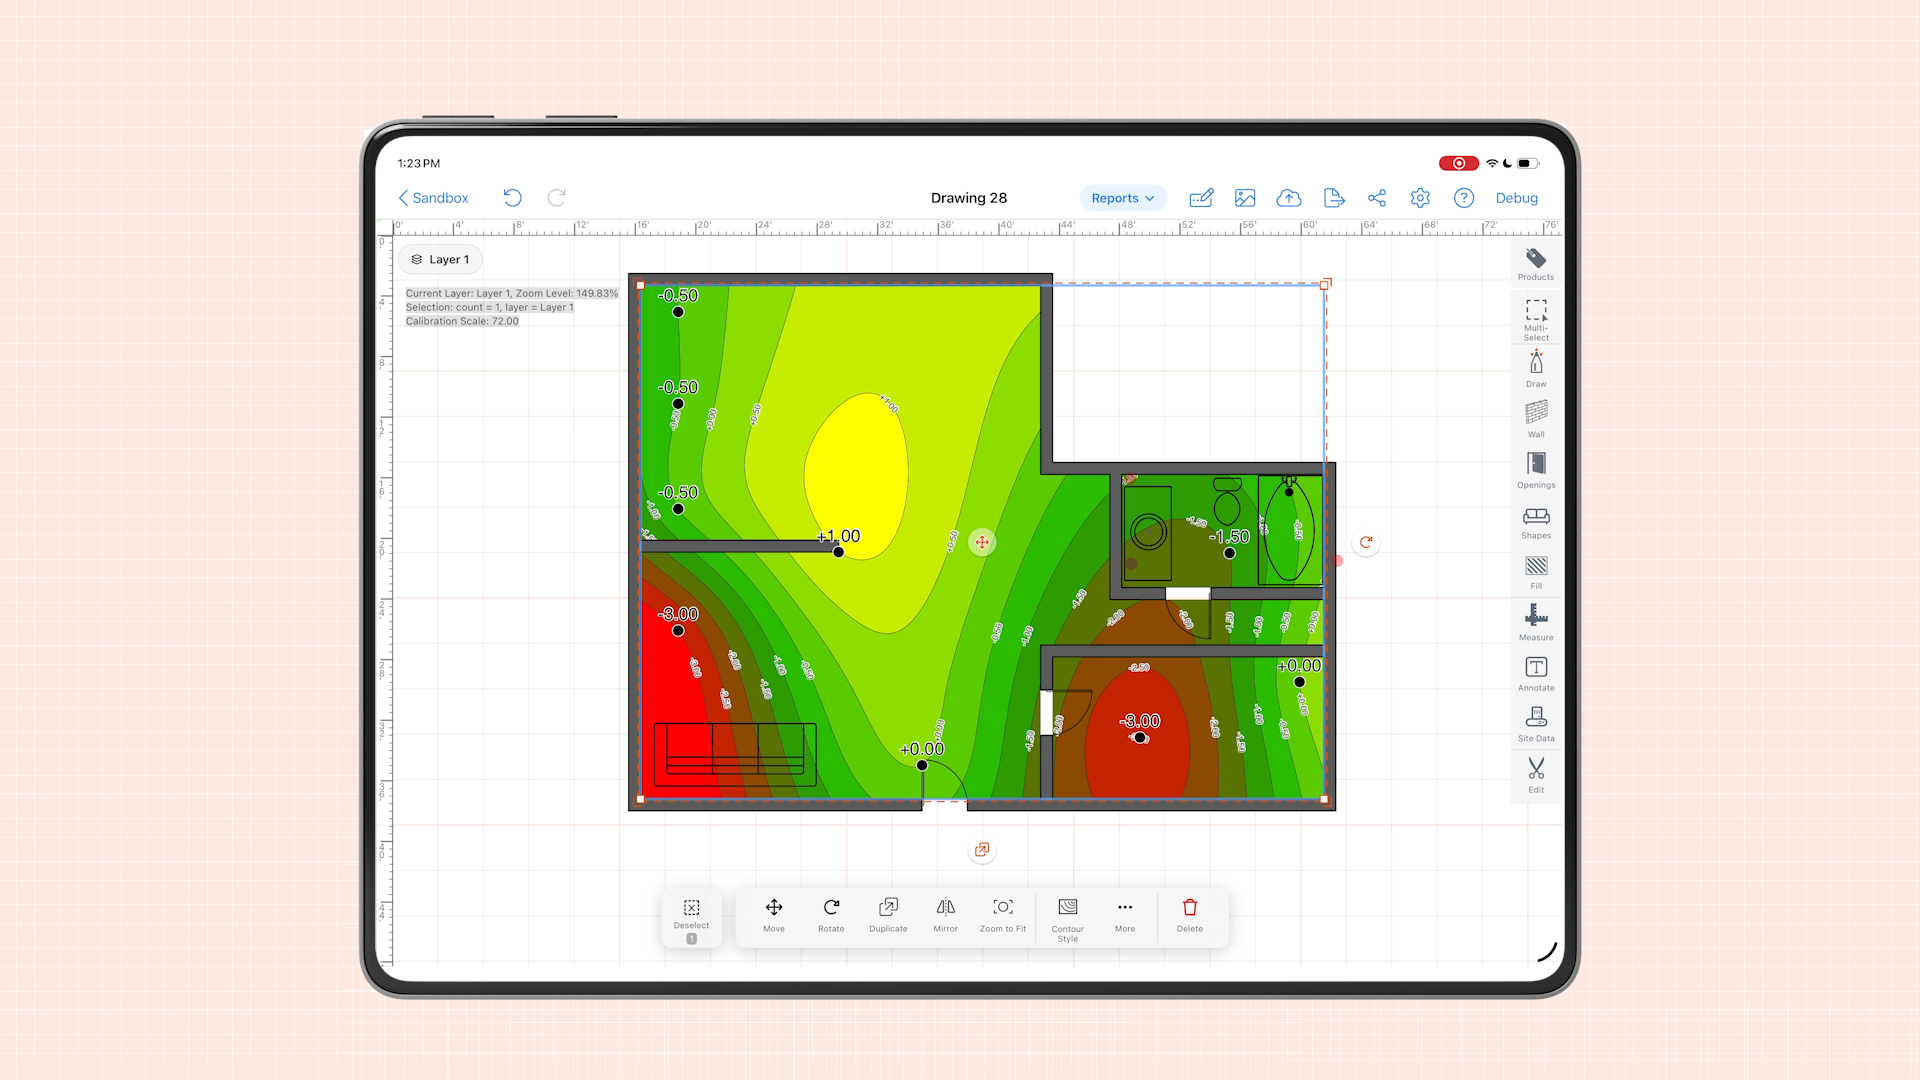
Patrick put it plainly: "The numbers don't tell a good story. A visual with red and green allows the homeowner to visually understand how severe a problem can be, and put it into a way that's hard to ignore."
Before the feature existed, getting to that visual meant leaving ArcSite entirely. A pro would build the drawing, then export the file to a third-party tool to plot elevation points, often a tool only one or two people in the office knew how to run. The field rep would take measurements on-site, then wait, sometimes drive back to the office, before a proposal could actually go out.
Topographic Drawings closes that loop. Elevation data now lives in the same drawing as everything else, and any rep in the field can generate the visual on the spot.
The decisions that made it work
Building a feature is one thing. Building one that survives contact with an actual job site is another. A few choices mattered more than the rest.
Foundation repair and waterproofing pros routinely plot 20, 30, sometimes 50 elevation points on a single drawing, so the data entry had to be fast. The team built a keypad that switches between positive and negative readings without breaking stride.
Usability testing surfaced a second problem: pros don't all measure from the same reference point. Some start at the front door. Some find the highest spot on the property first. The original build forced everyone to plant their zero point before adding data, which meant walking the whole house twice if you picked the wrong starting spot. The fix let pros reset the zero after the fact, and every other point on the drawing updates with it. Less time hunting for a reference point, more time in front of the client with the map.
Then there's the heat map itself. Getting the red-to-yellow-to-green gradient right meant the difference between a chart and a warning. The team tuned it to make severity obvious at a glance, and to work whether the job is a foundation, a fence line, or a putting green.
Testing it where the work actually happens
Product decisions made in an office don't always hold up on a job site in July. So the beta ran on real production jobs: hundreds of reps, in the field, in conditions that ranged from freezing to 100 degrees, with the tool working offline the whole time.
The team also talked past their obvious audience. Foundation repair was the clear use case, but the discovery process pulled in inspectors, salespeople, and structural engineers too, each of whom touches a project at a different point and needs different information at that moment.
Uses nobody planned for
Ask a product team what surprised them, and you'll usually get an honest answer. Patrick's: pros are already finding uses that were never on the roadmap.
One client wanted to capture elevation outside the structure entirely, not to diagnose the foundation, but to map how water flows in or out around it. Another use showed up in landscaping, where contractors building putting greens use the same elevation tool to plot the break lines they design into the turf, then show homeowners exactly how a putt will roll before a single shovel hits the ground.
Neither was the original brief. Both are now part of why the feature matters.
What success looks like from here
The team is watching two numbers over the next six months: proposal win rate and average contract value. Before this feature, describing a foundation problem to a homeowner meant fighting an uphill battle with a page of numbers. Now the visual does the arguing. A few points of win rate and a bump in contract value would confirm what the beta already suggested.
But the bigger signal, per Patrick, is what pros do with it that nobody on the product team predicted. That's the pattern with every feature ArcSite ships: build for the use case you know, then watch the field teach you the ones you didn't.
Topographic Drawings is live now. If you're already plotting elevation points the hard way, or not plotting them at all because the old process wasn't worth the drive back to the office, this is built for you. Book a demo here.
Categories
INDUSTRY


FAQs
Related posts